Four years ago I tried to size the underbanked market. We knew it was lots of people, but weren’t sure if they are “underbanked” because they’re unbankable. Do they make bank? (Answer: hell yes). We have since partnered with CFSI, and now with Morgan Stanley, to formalize and serialize this research.
So, the numbers are in for 2012 (it’s about time) and here’s the upshot (and here’s the report): The underbanked, or “financially underserved” as this paper calls them, spent approximately $89 billion on fees and interest payments last year. A lion share on cars (and subprime auto loans are the fastest growing credit product, to boot: projected to grow 23% during 2013). Prepaid cards (both general purpose and payroll) are projected to grow over 20% this year (it was closer to 30% YOY growth last year!). We expect refund anticipation loans to drop in 2013 after topping the growth chart of “very short term credit products” (<30 day credit products), 10% vs 25%, respectively. Short term credit products, as a group, yielded more fees/interest payments than all other products combined (almost $50b).
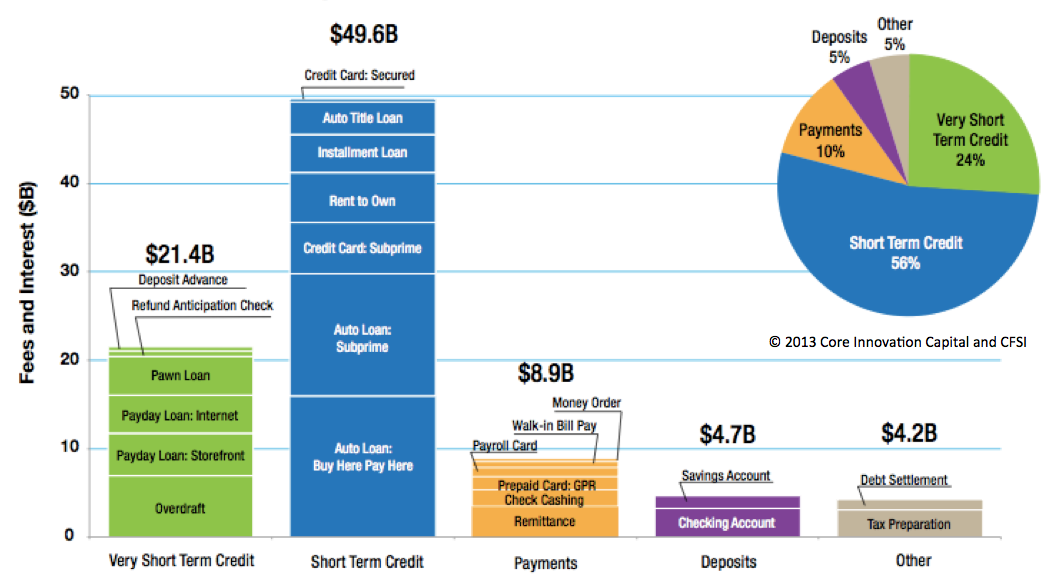
Some surprises of note: Check cashing shrunk during 2012 and we expect it will grow in 2013, despite the fact that federal benefits went mostly electronic this year. I think it’s because an improvement in the economy and higher fees associated with personal checks (or hand-written business checks). We further anticipate a significant growth reduction in internet payday products, largely resulting from recent DOJ and state AG crack-downs. Finally, checking accounts are going to grow 4x of last year’s growth due to the disappearance of free checking – in turn due to the reduction of overdraft.
Download the report. Next week, I’ll share some industry maps which highlight the who’s who in payments, credit and savings and financial capability.
Link to the report isn’t working – http://www.cfsinnovation.com/system/files/RES_2012%20Market%20Size%20Knowledge-Brief-Dec2013%20(1).pdf
[…] week, CFSI and Core published the 2012 market sizing report for companies serving the Emerging Middle Class. $89B across five categories of products during […]
Often times, we don’t think about the underbanked, meaning the segment of the population that is “financially… http://t.co/NN3gwlaqbF
[…] a follow up to their 2012 market sizing report , CFSI and Core Innovation Capital published this list of, in their words, “principal and […]
Can I get a copy of this report please?